01
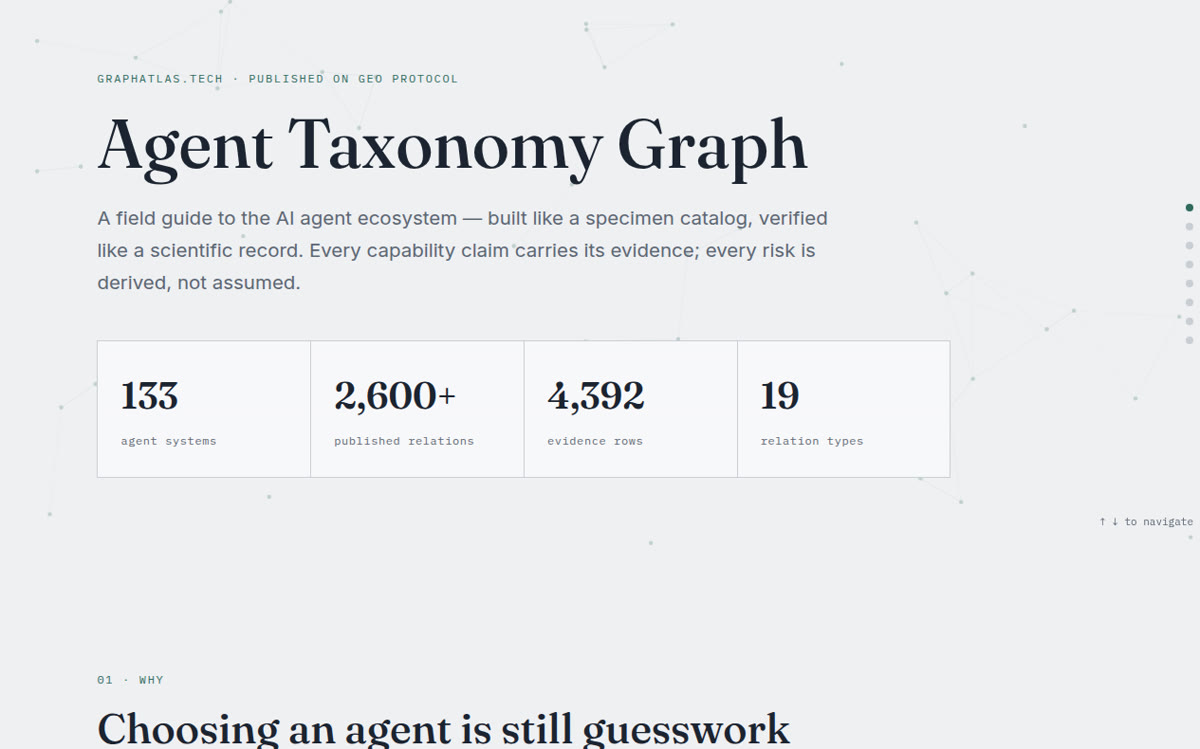
AI Atlas
Research lineage, concepts, papers
EXTERNAL ↗
AI·ATLAS · KNOWLEDGE GRAPH
 ai.graphatlas.tech ↗
ai.graphatlas.tech ↗
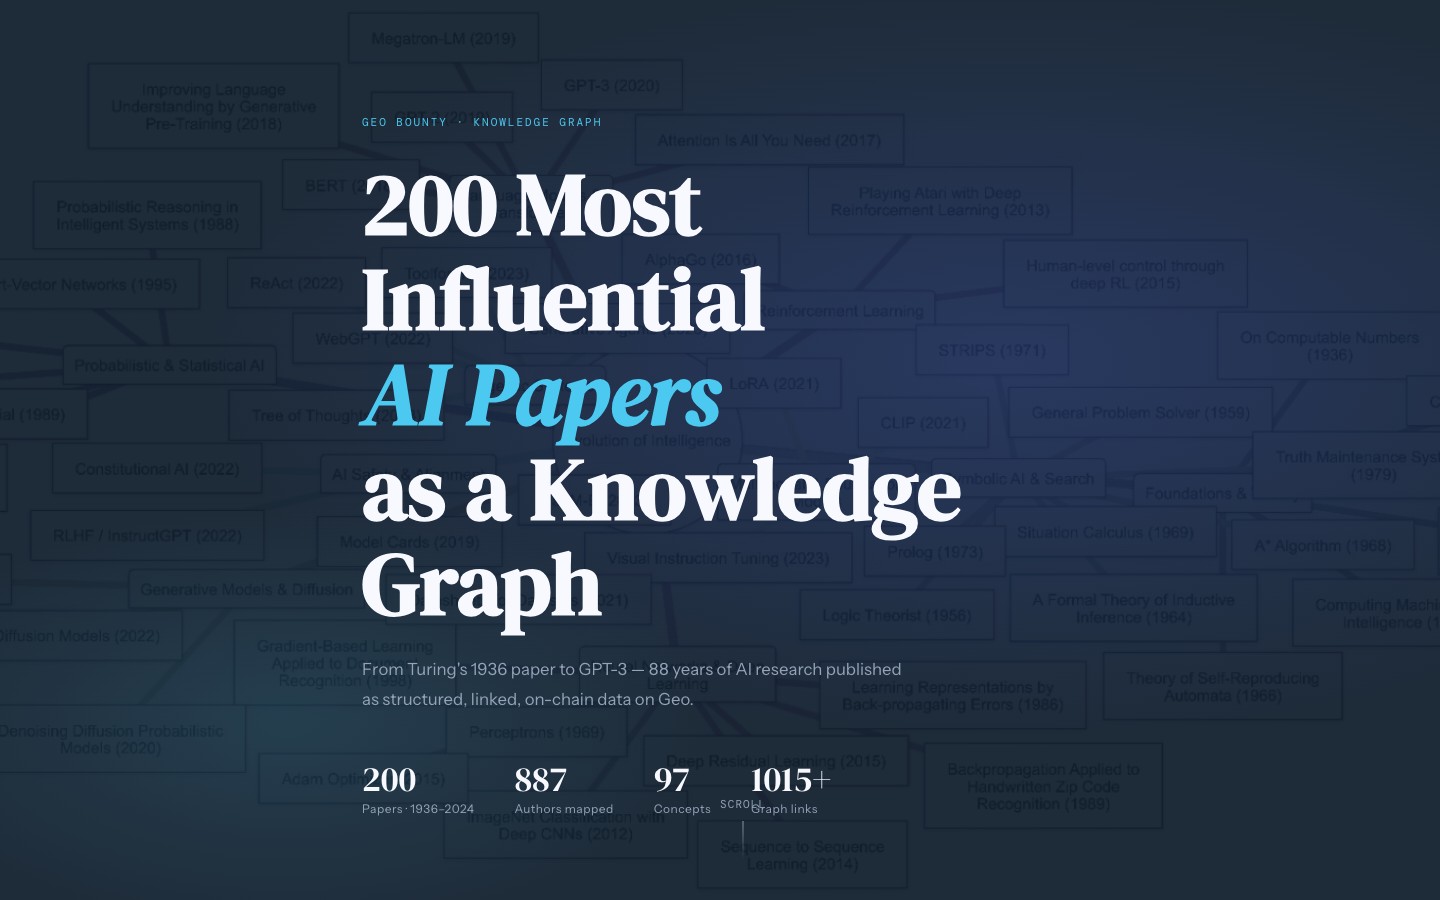
Papers
200
1936 — 2024
Authors
887
mapped
Concepts
97
curated
Links
1,015+
graph edges
Geo Protocol·
TypeScript·
Bun·
geobrowser.io